

Enrollment in ACA-compliant health plans may be at an all-time high

Sometime in the last few weeks, belatedly, CMS dropped its 2022 early effectuated enrollment snapshot for the ACA marketplace. Usually released in June, these annual snapshots show roughly what percentage of those who signed up for coverage during the Open Enrollment Period actually “effectuated” coverage — i.e., paid — as of February of the year in question (or March, in years with extended Open Enrollment Periods (OEPs). They also report average monthly enrollment for the prior year, as well as month-by-month tallies for that year.
The 2022 snapshots, which tallies 13.8 million on-exchange enrollees as of February of this year, indicates that enrollment in ACA-compliant health plans may be at an all-time high.
We already knew that enrollment via the ACA exchanges in OEP 2022, which was up 21% year-over-year, had surpassed the previous high-water mark, achieved in 2016, by a good margin — 14.5 million vs. 12.7 million. But on-exchange tallies during OEP leave out two important factors: off-exchange enrollment in ACA-compliant plans, and attrition — between initial enrollment and first payment, and throughout the year. *
To compare enrollment in 2022 and 2016, two factors need to be considered: the collapse of the off-exchange market in 2017 and 2018, and steady reductions from 2016 to the present in attrition.
Let’s take a look at both. First up: individual market enrollment on- and off-exchange, courtesy of the Kaiser Family Foundation (KFF). Note off-exchange enrollment in ACA-compliant plans, in deep blue.

Off exchange enrollment in ACA-compliant plans dropped from 5.4 million in Q1 2015 to 2.1 million in Q1 2019, by KFF’s estimate, responding mainly to skyrocketing premiums in 2017 and 2018. ACA premium subsidies are not available off-exchange. Average benchmark premiums increased by 20% in 2017 and 34% in 2018, apparently pricing out more than half of enrollees.
The 2017 increase was a clear market correction: insurers had underpriced in the new market, as ACA enrollees proved older and sicker than anticipated. Further, a 3-year reinsurance program, written into the ACA to stabilize a new market, expired in 2017. While marketplace insurers achieved profitability after the 2017 correction, in 2017 a fresh shock — election of Trump and Republican majorities in Congress, and the subsequent drive to repeal the ACA’s core programs, coupled with regulatory assault - - further disrupted pricing in 2018.
After the repeal drive failed (barely), premiums stabilized, barely moving from 2019 through 2022. Trump’s major regulatory blow — abrupt cutoff in October 2017 of direct payment to insurers for the value of the Cost Sharing Reduction subsidies they are required to provide to low-income enrollees in silver plans — had the paradoxical effect (long predicted by health insurance market analysts, beginning with HHS) of boosting subsidies and increasing enrollment, probably by about 5% annually. As the cutoff had been anticipated since Trump took office, regulators reacted swiftly, allowing or encouraging insurers to price the value of CSR directly into silver plans in advance of OEP for 2018. Since premium subsidies are set to a silver benchmark, the pricing-in increased subsidies along with silver plan premiums, creating discounts in bronze and gold plans.
In March 2021, the American Rescue Plan Act (ARPA) provided a massive boost to ACA premium subsidies at every income level — and removed the ACA’s notorious income cap on subsidies (400% of the Federal Poverty Level), which had decimated off-exchange enrollment after the premium hikes of 2017-2018. (The increase was temporary, extending through 2022, and then further extended through 2025 by the Inflation Reduction Act.) The subsidy increases came in the midst of an emergency Special Enrollment Period — effectively a new OEP — created by the Biden administration, running from February 15 through August 15 in the 36 states using the federal exchange, and joined, with some variation in dates, by the state-based exchanges. Removal of the income cap on subsidies helped boost on-exchange 2022 enrollment by those previously ineligible for subsidies by about 750,000 and by 2.5 million across all income levels.
Plan selections during OEP were 1.8 million higher in 2022 than in 2016 — not enough to cover the difference in off-exchange enrollment in ACA-compliant plans. The rest of the story is about retention. Shown below are annual totals for a) OEP enrollment (or “plan selections,” not always effectuated), b) early effectuated enrollment (as of the first month following OEP**), and c) average monthly enrollment.
ACA marketplace enrollment retention, 2016-2022 ***
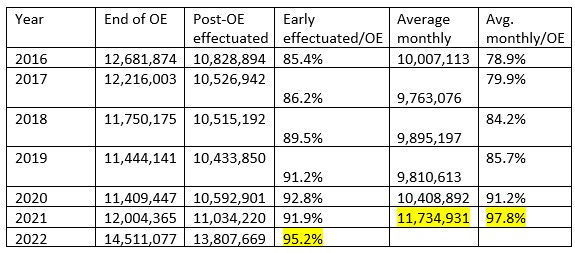
Note, for starters, that early effectuated enrollment in 2022 is just about 3 million higher than in 2016. And in light of retention patterns since 2016, the difference in average monthly enrollment will likely be larger yet.
Retention improved during the Trump years, as discussed in some detail here. In brief, shortened enrollment periods and radical cutbacks in advertising and outreach likely winnowed out more marginal enrollees, while Trump’s cutoff of direct CSR reimbursement to insurers, and the resulting discounts created by silver loading, increased the percentage of enrollees paying nothing or next to nothing for coverage. In 2020 the pandemic further reduced net attrition. As the lockdowns of spring 2020 triggered tens of millions of layoffs, 12 state exchanges opened emergency Special Enrollment Periods (SEPs) in which anyone who needed insurance could enroll with relatively little friction (varying somewhat by exchange). The Trump administration declined to open an emergency SEP for the 36 states using HealthCare.gov, but did reduce red tape for those who sought individual SEPs due to a qualifying "life change," usually loss of employer insurance. Enhanced unemployment insurance payments probably gave a further boost to off-season enrollment in states that had refused to enact the ACA Medicaid expansion, lifting some applicants’ income over the 100% FPL threshold for subsidy eligibility.
In light of recent retention patterns, can we forecast average monthly enrollment for this year? 2021 was anomalous, in that the long emergency Special Enrollment Period, coupled with the ARPA subsidy boost, overpowered normal attrition. So let’s look at 2020. Applying the difference in that year between early effectuated enrollment and average monthly enrollment would peg 2022’s average monthly enrollment at 93.6% of the OEP total, or 13,582,368. That exceeds the 2016 average monthly total by almost 3.6 million -- a difference larger than the estimated drop in off-exchange ACA-compliant enrollment through 2019. Perhaps this estimate is high: if average monthly enrollment as a percentage of OEP enrollment matches the 2020 level (91.2%), average monthly enrollment will come in at 13.2 million -- about 3.2 million higher than in 2016.
A caveat: by now, off-exchange enrollment may well have dropped further than it had by early 2019. In 2016, 84.7% of effectuated enrollees were subsidized; in 2022, 90.4% were. On the other hand, after the premium spikes of 2017-2018, premiums were close to flat from 2019 through 2021, so off-exchange enrollment may have stabilized in that time. At the same time, there’s been a steady erosion of “grandfathered’ (and “grandmothered” - -don’t ask…) pre-ACA individual market plan enrollment, estimated by KFF above at 1.1 million in 2019. Information about enrollment in off-exchange markets (also including ACA-noncompliant plan types encouraged by the Trump administration) is hard to come by (see Charles Gaba here, grappling with oddly mixed categories provided by Mark Farrah Associates). KFF should be out with new estimates soon.
Bottom line: early effectuated individual market enrollment in 2022 exceeds the 2016 level by about 3 million, and higher retention throughout the year will probably widen that gap. Effectuated subsidized enrollment was 12.5 million in early 2022, compared to 9.4 million in early 2016. Total individual market enrollment in ACA-compliant plans is about as high as it’s ever been, and far more heavily subsidized than in the Obama years.
Update, 10/31/22 (corrected 2/9/23): KFF did update its estimates of off-exchange enrollment and total individual market enrollment on Oct. 17. The new figures indicate that while total individual market enrollment was higher in 2015, “it’s likely ACA-compliant enrollment (both on- and off-Marketplace) is currently at a record high and that non-compliant enrollment is at a record low.”
——
*Average monthly enrollment brings in a third factor: enrollment outside of the annual OEP via Special Enrollment Period, whether personally applied for (because of changing life circumstances, such as marriage or divorce), or via universal emergency SEPs, which became a major factor during the pandemic.
** In each year’s effectuated enrollment snapshots, the totals for the prior year are revised. I have used the revised figures, published in the monthly totals for the prior year.
***Sources: CMS state-level public use files and effectuated enrollment snapshots